In this Jmeter Tutorial you will learn about Listeners. Listener is used to view result of the test execution in JMeter. It allows user to view result of all the requests which is sent to the server and also allows us to view result in different format such as in the form of tables, graphs, trees etc.
It also allows us to collect and save the result of test plan and store result in XML or CSV format.
The following are the different types of listeners available in JMeter:
- Aggregate Graph
- Aggregate Report
- Assertion Results
- Backend Listener
- Bean Shell Listener
- BSF Listener
- Comparison Assertion Visualizer
- Generate Summary Results
- Graph Results
- JSR223 Listener
- Mailer Visualizer
- Monitor Results
- Response Time Graph
- Saves Responses to a file
- Simple Data Writer
- Summary Report
- View Results in Table
- View Results Tree
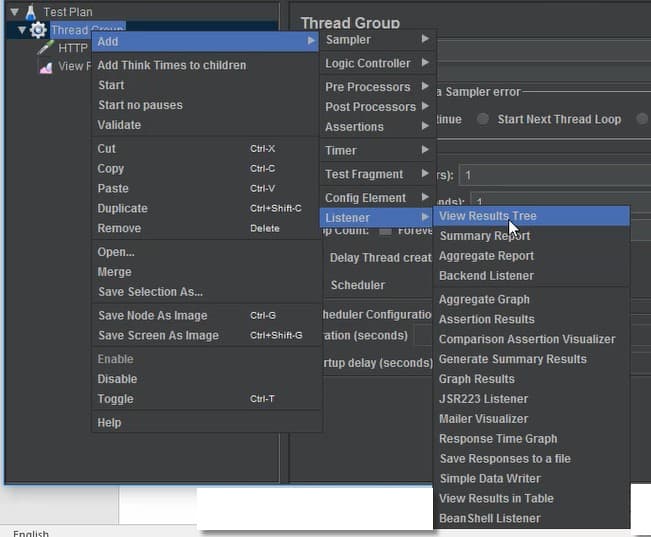
We can see the same in the screenshot given below. It is added after test is created. It is created under thread group.
Let’s look at some of the most commonly used listeners in JMeter.
Aggregate Graphs:
It is also one of the very important Listeners used in JMeter. It displays very important information like Throughput, Total number of samples, Average time, Time, 90% line, 95 % line, 99% line, min which can be seen in the screenshot given below.
Min Contains minimum time taken by any sampler to reach the server, Max contain maximum time taken by the request to reach to the server, Error % indicate total number of error sampler divided by total number of sampler.
Also contain information of the Throughput which means number of sample sent to the server per second. Also contain information of how many how much Kilobyte per Second Received by the client and how much kilobyte per second sent to the server.
Now there are three columns like 90% line, 95 percent line, 99% line. Let us understand that one by one. 90% line indicates that only 10% of the total sampler has exceeded this time to reach to the server. Same concept applies to 95% line and 99% line. These are important data which are analyzed while doing load testing in JMeter.
It is very similar to aggregate report listener but the most important advantage of using it is that it also provides graphical representation of the data given in the form of report which makes it very easy for the load tester to analyze the result and do some planning to improve the performance of the web application. We can see selection Graph the same in the screenshot given below.
We can see sample result of Aggregate Graph in the screenshot given below.
One more thing to be noted here is that Aggregate Graph Listener does not only show the results in statistical form, it also display the result in the form of graph.
There is no difference between statistical report of Aggregate Graph Listener and Aggregate Report Listener. Only advantage with Aggregate Graph is that it has capacity to produce result in graphical form. Let us see how to produce graphical result in Aggregate Graph Listener.
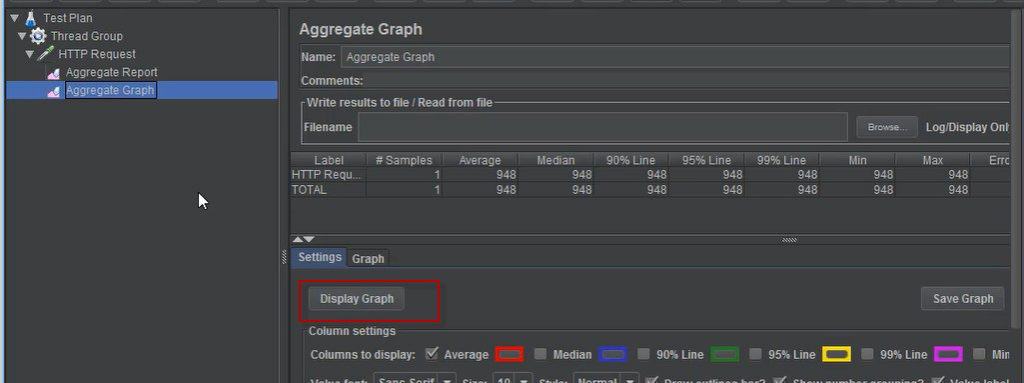
We can see in the screenshot given below that apart from showing result in the statistical form, where are all the important informations are displayed in the form of table, it has option to display graph and there is Display Button to serve this purpose. We can see Display Button in the screenshot given below.
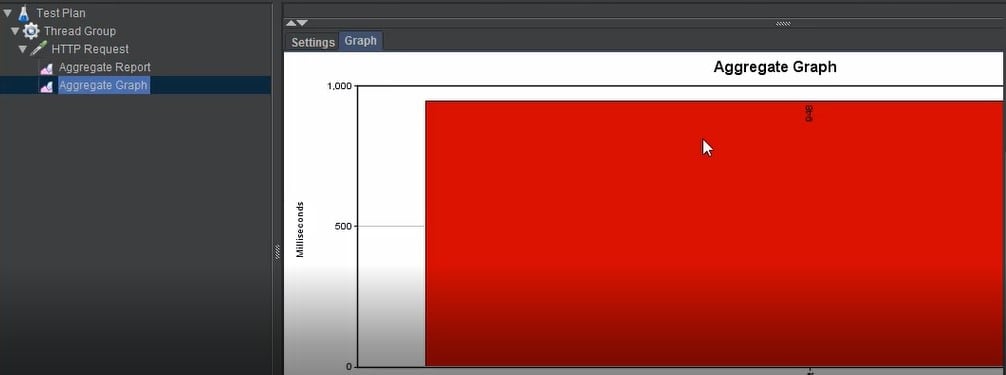
Now we can see the result in the graphical form after clicking on Display Graph button in the screenshot given below. Graph displays result of all the samplers/ requests used in the test.
The graph shown in the screenshot given below shows the result of one sampler/ request.
Aggregate Report
It is very similar to Aggregate Graph Listener. The only difference is that it is not provided with the facility of showing the result in the graph. All the report shown in Aggregate Graph is same as Aggregate Report Listener.
Also, format of report is also same in both the listeners. We can see the same in the screenshot given below.
Assertion Results
As the name itself is telling, this Listener is used to verify whether any assertion applied to the samplers/requests have passed or failed. It may be used to perform basic testing in order to check whether the test is complete and correct, so that load is applied on the samplers in order to do load testing. It is also not recommended to be used during load testing as it consumes a lot of resources like memory and CPU.
As we know that Assertion Results Listener is used for validating assertion result, it so it should be created only after assertion is created for any sampler/ request.
In the screenshot given below, we can see that Assertion Results Listener has been created after Response Assertion is created.
View Results In Table
It is one of the most commonly used listeners in JMeter. It is very simple to use and contains very important information like Sample Time, Latency, Connect Time etc which is very helpful in analyzing the result.
Sample Time is the time taken to get the response of the request to reach back to the client after the request is processed by the server.
Latency is the time taken by first bite of the response to reach back to the user which sends the request. Connect Time is the time that request takes to reach to the server.
This listener displays data in the form of table with rows and columns. It is not recommended to be used during load testing as this Listener itself consumes lots of resources like memory and CPU. It is just used for doing basic testing before doing final load testing.
View Results Tree
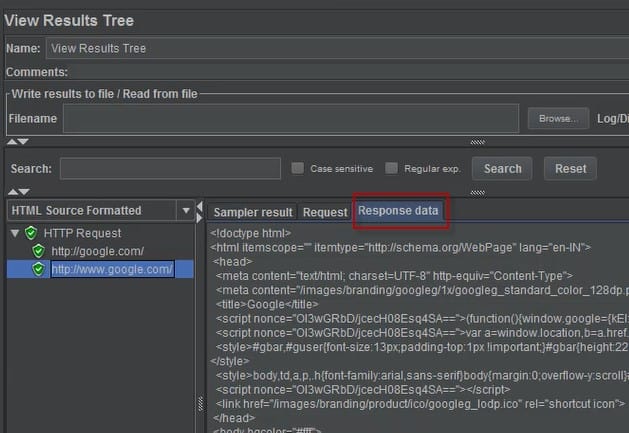
It is also very important type of listener which is used in JMeter. The advantage of this Listener is that we can see the request and response using this listener.
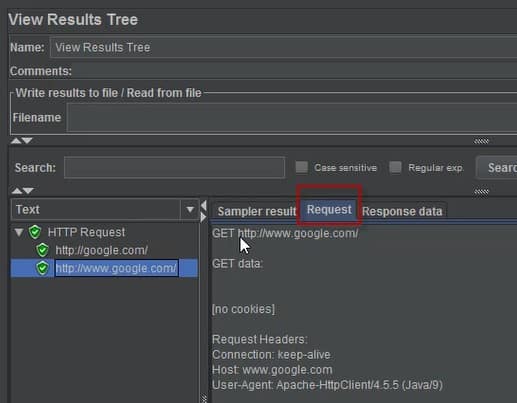
We can check the request also and many times when the test fails, we are able to find the reason by seeing the request available in this listener. In the screenshot given below we can see request of the sampler/request in View Results Tree Listener.
In the screenshot given below, we can see we can see response of the sampler/request returned from the server in the form of response.
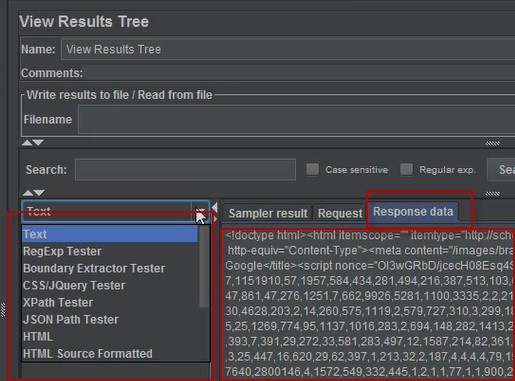
One more important thing to understand here is that we can see the response in different formats such as text, HTML etc. We can put different type of is assertions after seeing the response.
It is also not recommended to be used during load testing as it consumes a lot of resources like memory and CPU. It is also used for doing basic testing like checking the response before doing final load testing.
Different formats available in the response action can be viewed from the control dropdown like Text, RegExp Tester, CSS/JQuery Tester, XPath Tester, HTML, HTML (download resources), Document, and JSON, which can be seen in the screenshot given below.
Overall, we can say that Listeners are very important part of JMeter and helps in collecting results from all the samplers and displaying collective result as whole.
