We always prefer to use Jmeter GUI as it will give real-time Execution information such error, request/sec, throughput etc. But due to various other reasons (Load, CI/CD, distributed testing, etc.). We forced to use command line mode of Jmeter.
So if we want to execute the test in command line we need to prepare the script dynamic as possible. Such as host name, ramp up, number of users, etc.
Jmeter lets you pass parameters in command line mode. We can define as much as variables in the “user defined variables”. User defined variables can be added from Test Plan >> Config Element.

Basic Command line Execution (Non-GUI)
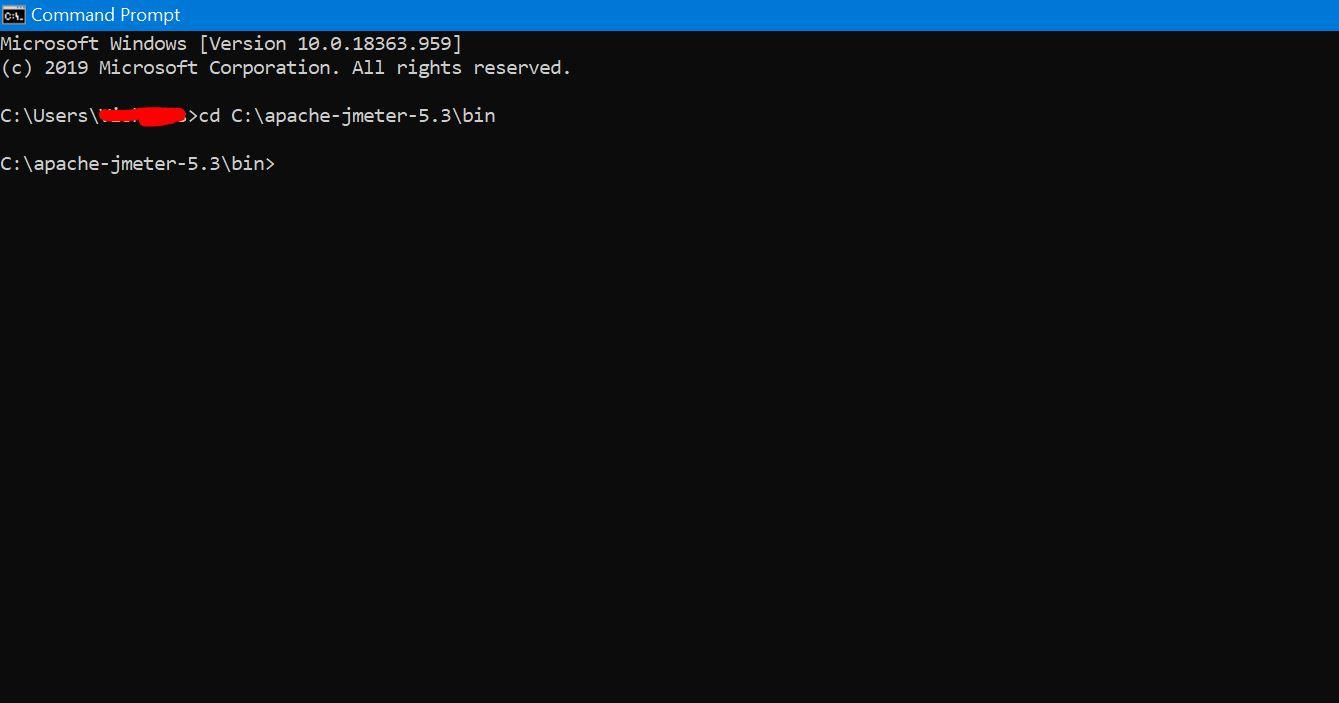
You need to first go to you Bin location of your Jmeter installation through CMD.
There is 2 ways to execute the Non-GUI mode. Either your script and result file can be added to Jmeter bin location or write the full path in the command
- jmeter -n -t ScriptName.jmx -l results.jtl
- jmeter -n -t C:\Users\Desktop\Workup\ ScriptName.jmx –l C:\Users\Desktop\Workup\ results.jtl
Where,
-n – instruct jmeter run the test in non-GUI mode.
-t – specify the path of .jmx file.
-l – instruct to write into log file results

In case you want to send additional parameters, you can add below as well.
Other than these options, Jmeter has several other parameters that can be used for running in the non-GUI mode.
-R: list of remote servers – Used for distributed testing
-H: proxy server hostname
-P: proxy server port
You can also use the properties which are mentioned in the user defined properties with the help of Jmeter __P function.
Example:

- No. of threads – ${__P(threads,10)} – number of concurrent users to execute, default will be 10.
- Ramp up- ${__P(rampup,300)} – Duration between test start and peak load. default will be 300 seconds.
- Duration of the test -${__P(Duration,1800)} – Total Duration for the test. Default will be 1800seconds.
This can be directly passed into Non-GUI mode execution. So whenever there is environment change in the execution. You can easily change it from CLI. Not even need to open the Jmeter GUI for script edit.
jmeter -jthreads -jrampup -jDuration -n -t ScriptName.jmx -l results.jtl
Please refer the below Jmeter official reference for P function usage. https://jmeter.apache.org/usermanual/functions.html
Running Jmeter Behind the Proxy
If you are working for an enterprise organization or your client is having a secure network, most probably there will be proxy server for internet connectivity. This will not allow jmeter to connect and execute the performance test in a normal way. Solution for that is to provide firewall/proxy server hostname and port number to jmeter. You can run jmeter.bat/ jmeter.sh (depends on your computer system) file from a command line with the following command and parameters.
jmeter -H <proxy name > -P <port number> -u <username> -a <password > -N localhost
Where,
-H – proxy server hostname or ip address
-P – proxy server port
-u – username for proxy authentication
-a -password for proxy authentication
-N – Local host for recording
Here Username and password is not mandatory, only add it if required.
Jmeter Distributed Testing
If you organization is expecting very larger number of traffic or your client is having a business like ecommerce. There is a high chance that they will be running promotion on their site ex: Sale /black Friday. Then it will be your job as a performance tester to make sure that website is able to handle large number of concurrent users. You may already aware that we have a limitation when we ran the test with GUI mode in our local, even if your computer has enough CPU and memory. Solution to this problem is running Jmeter Non-GUI distributed mode. Distributed mode is Master-Slave architecture where Jmeter uses Java RMI to interact with slaves.
Preparation before distributed testing
We need to prepare our clients and master for distributed testing. First we need to connect slaves with master for execution.
Master Configuration:
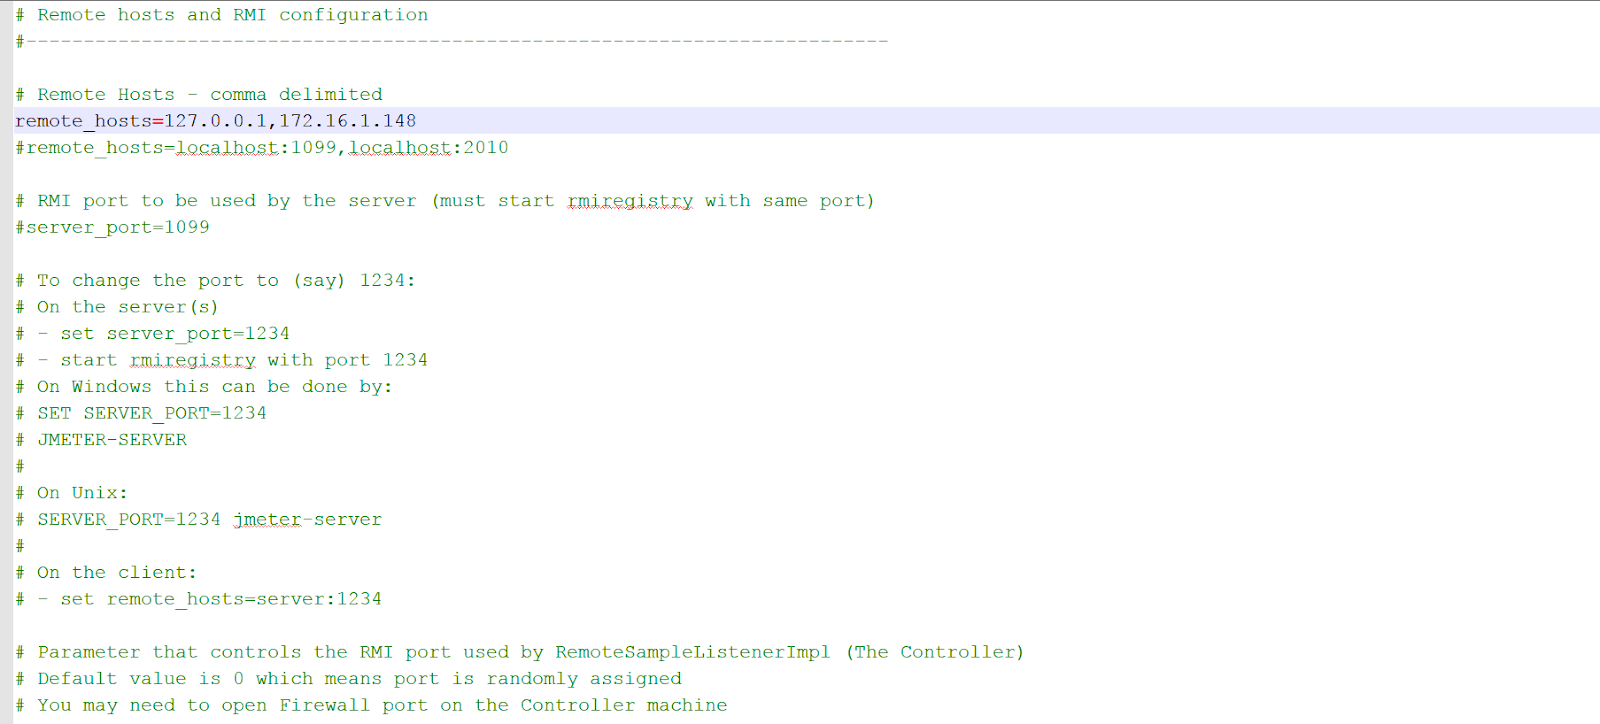
You need to make sure that, Jmeter version is same in both client and master. Then go to jmeter bin folder location in master system, locate jmeter. Properties file. Edit this file and add the IPs of all the slave systems that should be involve in the execution. Make sure the master and the slave systems are located in the same subnet.
Also all the scripts should be placed in master system.
Client configuration
We need to execute Jmeter Server on each slave system. For that purpose, we have to execute the jmeter-server.bat that is located in the jmeter bin location. Once we run it we should see success message like this.

Also you need place test data in each slave system separately. If you want 2000 user test, you need to start 8 slave systems and 1 master system, each instance can carry 250 users only. If it’s those machines having 4GB memory only..
Distributed test Execution
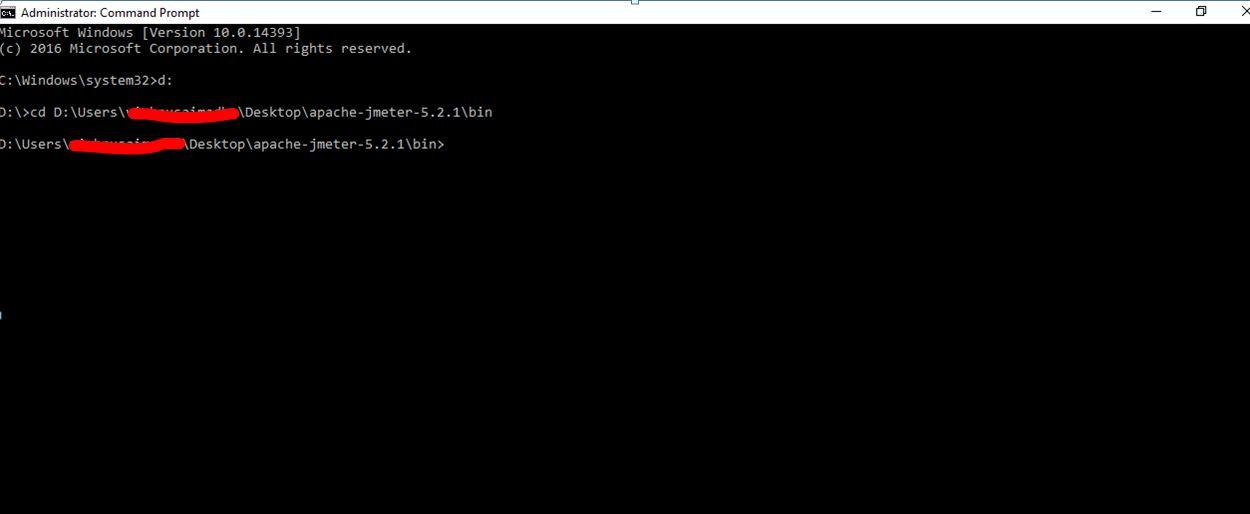
You need to go to Bin folder of Jmeter on command prompt

Then you need execute the below command.

Where,
-n – instruct jmeter run the test in non-GUI mode.
-t – specify the path of .jmx file.
-l – instruct to write into log file results
-R- list of remote servers / slaves for the test.
-g generate report – if you want to generate Dashboard report
Commands need to be modified based on number of users and slaves participating in the test. You can mention any number of slave ip’s in the command.
Report generation
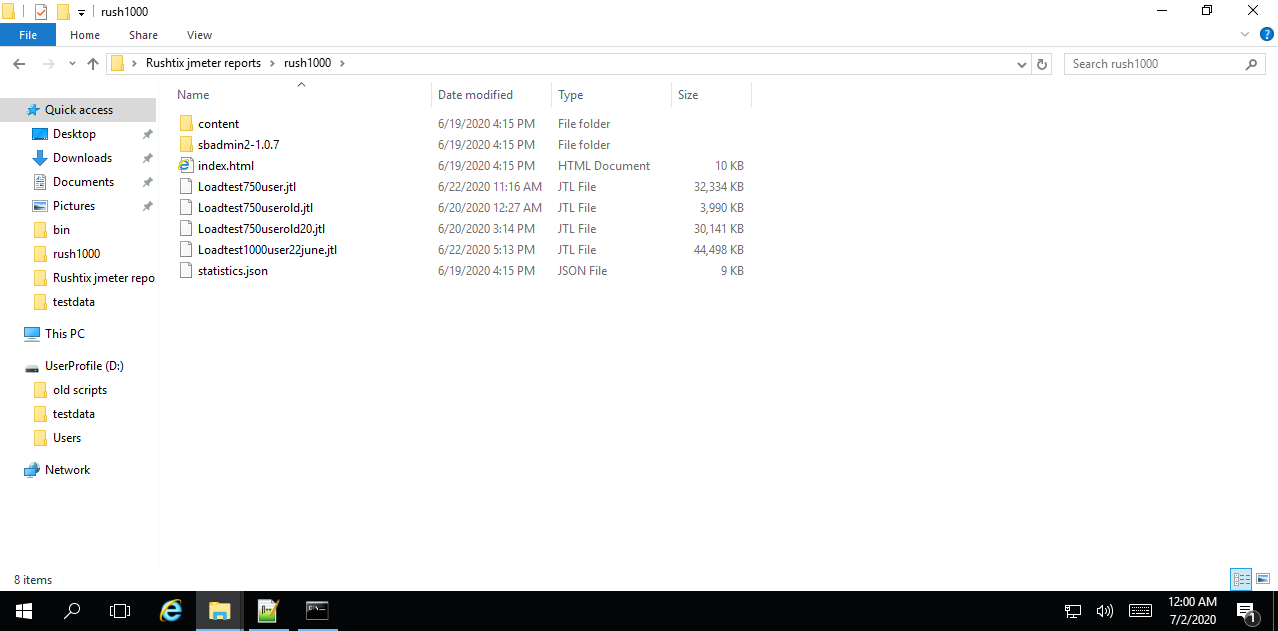
You need to grab the jtl file and upload into jmeter for report generation. You can also generate through command line execution.
Steps to generate Report
Open jmeter.bat file from jmeter bin folder.

Upload jtl file to jmeter
Upload it under generate HTML Report folder.
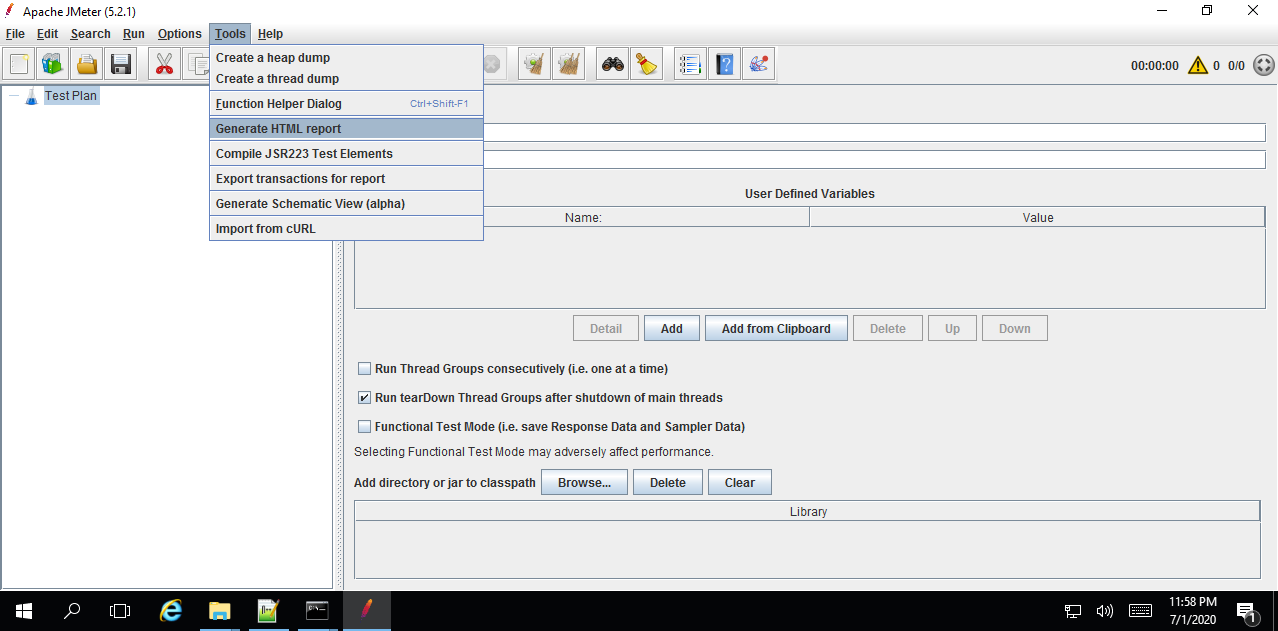

Once you upload properties and Jtl/csv file report will be generated.
Simple right? Now you have seen different CLI options which can be utilized full potential of JMeter. Do experiments and learn more .Happy performance testing.